Unity, a powerful game development engine, Unity Memory Profiler empowers developers to create immersive and engaging experiences across various platforms. As game complexity increases, so does the demand on system resources, particularly memory. Memory management is a critical aspect of game development, and inefficient memory usage can lead to performance issues, crashes, and a poor user experience. Unity provides a robust tool called the Unity Memory Profiler to address these challenges. In this article, we will delve into the intricacies of the Unity Memory Profiler, exploring its features, applications, and best practices.
Understanding the Significance of Memory Profiling
Before we dive into the Unity Memory Profiler, let’s first understand why memory profiling is crucial in game development. Memory management is the process of addresing and deallocating memory during runtime. In Unity, as in many game engines, developers have limited control over memory allocation due to the garbage collection system. Therefore, identifying and optimizing memory usage becomes essential to ensure optimal performance.
Memory profiling involves analyzing the memory consumption of a Unity application. It helps developers identify memory leaks, inefficient memory usage, and areas where optimization is needed. By using a memory profiler, developers can gain insights into their game’s allocation and deallocation patterns, enabling them to make informed decisions for better memory efficiency.
Introduction to Unity Memory Profiler
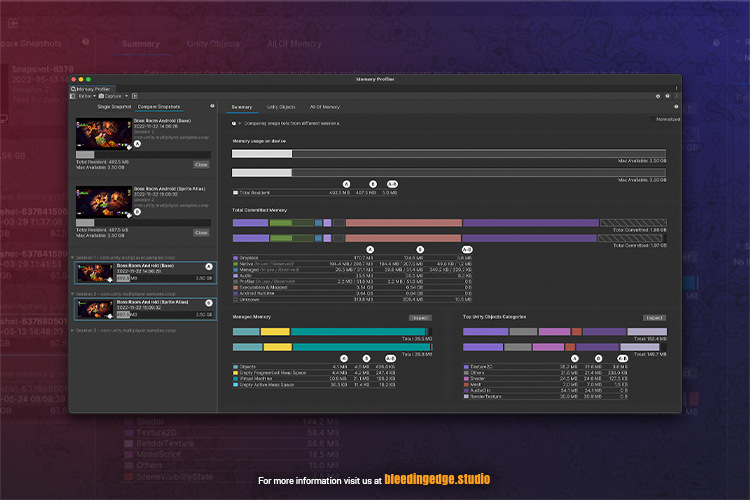
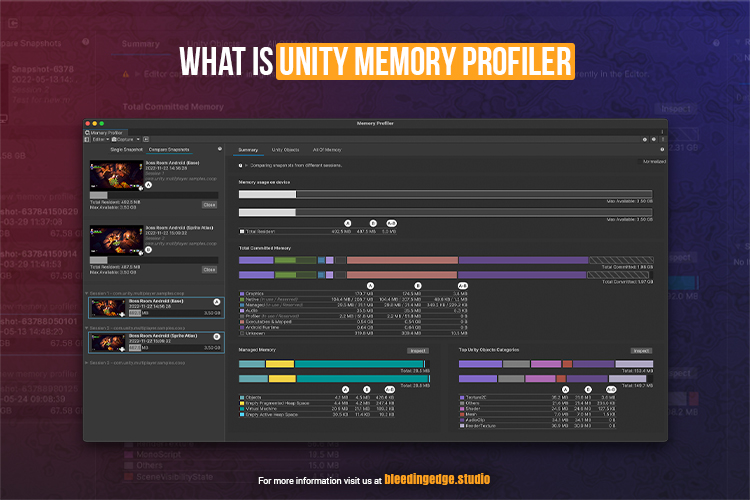
Unity Memory Profiler is a built-in tool that allows developers to monitor and analyze the memory usage of their Unity applications. It provides a detailed view of memory allocations, garbage collection, and other relevant information, helping developers identify and address memory-related issues.
Key Features of Unity Memory Profiler
- Memory Hierarchy:
-
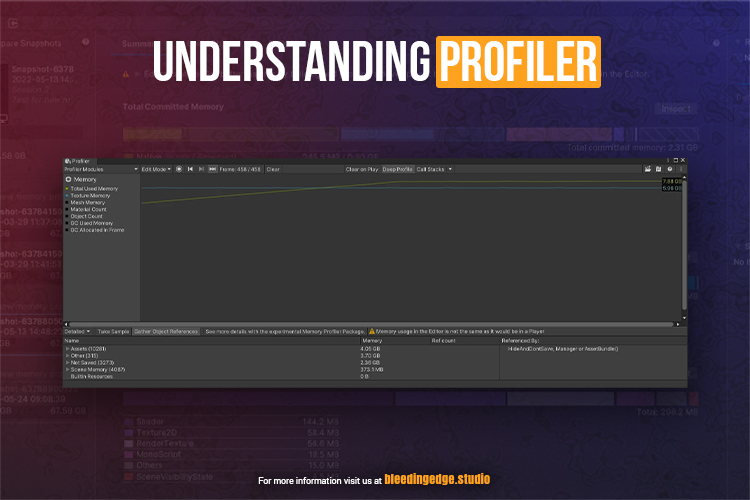
- The Memory Profiler provides a hierarchical view of memory usage, allowing developers to see the memory consumption of different objects in their scenes. This hierarchy includes assets, scenes, and individual game objects.
- Object Details:
-
- Developers can inspect individual objects to view details such as memory size, instance count, and references. This level of granularity is essential for pinpointing memory-consuming elements in the game.
- Snapshot Comparison:
-
- Unity Memory Profiler allows the comparison of memory snapshots, enabling developers to identify changes in memory usage over time. This feature is handy for tracking down memory leaks.
- Garbage Collection Insights:
-
- The tool provides information about garbage collection events, helping developers understand when and why garbage collection occurs. This knowledge is crucial for optimizing memory management and reducing the impact of garbage collection on performance.
- Memory Markers:
-
- Memory markers allow developers to mark specific points in the game and analyze memory usage at those points. This feature aids in understanding the impact of certain game events on memory.
Now, let’s explore how to use Unity Memory Profiler effectively.
Utilizing Unity Memory Profiler
- Opening the Memory Profiler:
To access the Unity Memory Profiler, follow these steps:
- Open the Unity Editor.
- Click on “Window” in the top menu.
- Navigate to “Analysis” and select “Memory Profiler.”
- Capturing a Memory Snapshot:
- Once the Memory Profiler is open, start your game within the Unity Editor.
- Click the “Take Sample” button in the Memory Profiler window to capture a memory snapshot.
- Analyzing Memory Data:
- Examine the memory hierarchy to understand the distribution of memory across different objects.
- Drill down into specific objects to view detailed information about their memory usage.
- Use the comparison feature to analyze changes in memory usage between snapshots.
- Identifying Memory Leaks:
- Look for objects that persist across multiple snapshots but should have been deallocated.
- Check for increasing memory usage over time, which may indicate a memory leak.
- Optimizing Memory Usage:
- Evaluate the memory impact of assets and scenes.
- Consider using asset bundling to reduce memory overhead.
- Object pooling is used to recycle and reuse objects instead of frequently creating and destroying them.
- Garbage Collection Optimization:
- Minimize using Instantiate and Destroy functions during gameplay, as they can trigger frequent garbage collection.
- Avoid excessive allocations within update loops to reduce the frequency of garbage collection events.
Best Practices for Unity Memory Profiling
- Regular Profiling:
-
- Make memory profiling a regular part of your development process. Profiling early and often can help identify and address memory issues before they become critical.
- Use Memory Markers:
-
- Utilize memory markers to analyze memory usage during specific game events. This can provide insights into how different aspects of your game impact memory.
- Test on Target Platforms:
-
- Memory usage can vary between different platforms. Always test your game on target platforms to ensure optimal memory performance.
- Profile Real Gameplay Scenarios:
-
- Profiling should not be limited to specific scenes or situations. Profile your game in real gameplay scenarios to capture a comprehensive view of memory usage.
- Collaborate with Profilers:
-
- Collaborate with profiling tools like Unity Profiler, which provides a broader CPU and GPU performance analysis. Combining memory and performance profiling can give a holistic view of your game’s health.
- Optimize Resource Loading:
-
- Load resources dynamically and unload them when they are no longer needed. This can prevent unnecessary memory consumption.
- Monitor Texture Memory:
-
- Textures can consume a significant amount of memory. Use compressed textures where possible and monitor texture memory usage closely.
Unity Memory Profiler plays a crucial role in game optimization by providing developers with insights into the memory usage of their Unity applications. Efficient memory management is essential for optimizing game performance, and the Memory Profiler serves as a valuable tool in achieving this goal. Let’s explore how Unity Memory Profiler contributes to game optimization:
- Identifying Memory Leaks:
- Memory leaks occur when objects are not correctly deallocated, leading to a gradual increase in memory usage. The Memory Profiler allows developers to identify and address memory leaks by tracking the allocation and deallocation of objects. This is vital for ensuring that memory is released when it is no longer needed, preventing excessive memory consumption and potential crashes.
- Analyzing Memory Hierarchy:
- The Memory Profiler provides a hierarchical view of memory usage, allowing developers to understand how memory is distributed across different assets, scenes, and game objects. This information is instrumental in optimizing resource-heavy components, such as high-resolution textures or 3D models, to reduce overall memory overhead.
- Optimizing Asset Loading:
- By analyzing memory snapshots, developers can identify assets that consume significant memory. This insight enables them to optimize asset loading strategies, such as asset bundling or streaming, to reduce memory usage. Efficient asset management is important for maintaining a smooth gaming experience, especially on platforms with limited resources.
- Reducing Garbage Collection Impact:
- Unity employs a garbage collection system to manage memory automatically, but excessive garbage collection events can impact performance. Memory Profiler helps developers identify areas in the code that generate unnecessary garbage, allowing for optimization by minimizing memory allocations and deallocations during critical gameplay moments.
- Platform-Specific Optimization:
- Memory usage can vary across platforms (e.g., PCs, consoles, mobile devices). Unity Memory Profiler allows developers to test and optimize their games on target platforms, ensuring that memory performance meets each platform’s specific requirements.
- Preventing Out-of-Memory Issues:
- Memory issues, such as leaking out of memory, can result in crashes and negatively impact the player’s experience. Unity Memory Profiler helps developers proactively identify and address potential memory-related issues before they escalate, ensuring the stability and reliability of the game.
- Iterative Development and Testing:
- Integrating memory profiling into the development workflow allows developers to test and optimize their code iteratively. This iterative approach ensures that memory optimizations are ongoing throughout development rather than being addressed as a last-minute concern.
- Collaboration with Other Profiling Tools:
- Unity Memory Profiler can be used with other profiling tools, such as the Unity Profiler, for CPU and GPU performance analysis. Combining memory profiling with broader performance analysis provides a comprehensive view of the game’s health, enabling developers to address memory and performance bottlenecks.
Memory management is a critical aspect of game development, and memory leaks can significantly impact the performance and stability of a game. Memory leaks occur when allocated memory is not deallocated correctly, leading to a gradual increase in memory usage. Detecting and addressing memory leaks is essential for creating optimized and reliable games. The tracking profiler is a powerful tool in a developer’s arsenal for understanding and mitigating memory leaks.
What is a Tracking Profiler?
A tracking profiler is a specialized tool designed to monitor and analyze memory usage during a game’s runtime. Unlike traditional profilers that focus on performance metrics, a tracking profiler is specifically tailored to identify and track memory allocations and deallocations. A tracking profiler helps developers pinpoint memory leaks and optimize memory usage in their games by providing detailed information about memory-related events.
Key Features of Tracking Profilers
- Real-time Monitoring:
- Tracking profilers offer real-time monitoring of memory allocations and deallocations during gameplay. This feature allows developers to observe how memory usage evolves throughout a gaming session, making identifying patterns associated with memory leaks easier.
- Memory Snapshot Comparison:
- Like other profilers, tracking Unity Memory Profiler allow developers to capture memory snapshots at different points in time. Comparing these snapshots enables developers to identify changes in memory usage, making it possible to isolate and investigate potential memory leaks.
- Detailed Memory Insights:
- Tracking profilers provide detailed insights into memory-related events, including information about allocated memory blocks, sizes, and references. This level of granularity is crucial for understanding the root causes of memory leaks.
- Call Stack Information:
- Tracking profilers often include call stack information for memory allocations to facilitate debugging. This feature helps developers trace the origin of memory allocations, making it easier to identify the source of memory leaks in the code.
- Automatic Leak Detection:
- Some tracking profilers offer automatic leak detection capabilities. By continuously monitoring memory usage, these profilers can identify objects that are not adequately deallocated, providing developers with instant feedback on potential memory leaks.
- Integration with Development Environments:
- Tracking Unity Memory Profiler are designed to integrate seamlessly with popular game development environments, including engines like Unity and Unreal Engine. This integration simplifies the process of incorporating memory tracking into the development workflow.
How Tracking Profilers Help Understand Memory Leaks
- Continuous Monitoring:
- Memory leaks often manifest over time, and their effects may be apparent. Tracking profilers continuously monitor memory usage, allowing developers to observe how memory evolves during extended gameplay sessions. By identifying gradual increases in memory usage, developers can pinpoint potential leaks.
- Snapshot Analysis:
- Taking memory snapshots at different points in the game provides a snapshot of the memory landscape at those moments. Developers can compare these snapshots to identify objects that persist across multiple snapshots, indicating potential memory leaks. This comparative analysis is invaluable for understanding the progression of memory-related issues.
- Call Stack Examination:
- Tracking profilers offer call stack information for memory allocations, enabling developers to trace the sequence of function calls leading to memory allocation. Examining the call stack helps identify the specific code paths responsible for the memory leak, facilitating targeted debugging and optimization efforts.
- Automatic Leak Detection:
- Profilers with automatic leak detection capabilities actively scan for objects that persist in memory without proper deallocation. This automated approach reduces the manual effort required to identify memory leaks, allowing developers to focus on resolving issues rather than spending extensive time on detection.
Best Practices for Using Tracking Profilers
- Start Early in Development:
- Integrate tracking profilers into your development workflow from the early stages of game development. Identifying and addressing memory leaks early on can prevent the accumulation of issues that become more challenging to resolve later.
- Simulate Real Gameplay Scenarios:
- Using tracking profilers, simulate real gameplay scenarios to capture a representative memory profile. This ensures that the profiler monitors memory usage in conditions that closely resemble actual gameplay, helping identify and address leaks that may occur during specific in-game events.
- Regularly Capture Memory Snapshots:
- Take memory snapshots regularly, especially during critical moments in the game. Comparing snapshots allows developers to track changes in memory usage and detect potential leaks. Establish a routine for snapshot capture to facilitate consistent monitoring.
- Utilize Automated Leak Detection:
- If your tracking Unity Memory Profiler offers automated leak detection, use this feature. Automatic detection can significantly reduce the time and effort required to identify memory leaks, allowing developers to focus on resolving issues promptly.
- Collaborate with Other Profiling Tools:
- Combine the insights from tracking profilers with data from other profiling tools, such as performance and debugging. A holistic approach to profiling provides a comprehensive understanding of the game’s memory and performance aspects.
- Address Memory Leaks Iteratively:
- Address identified memory leaks iteratively, focusing on one issue at a time. Systematically tackling memory leaks ensures that each issue is thoroughly understood and resolved before moving on to the next. This approach helps claim the stability of the game throughout the optimization process.
- Document and Share Findings:
- Document your findings using tracking Unity Memory Profiler, including information about identified memory leaks, their root causes, and the steps to address them. Sharing this information with the development team promotes knowledge sharing and adds to a collective effort in optimizing the game.
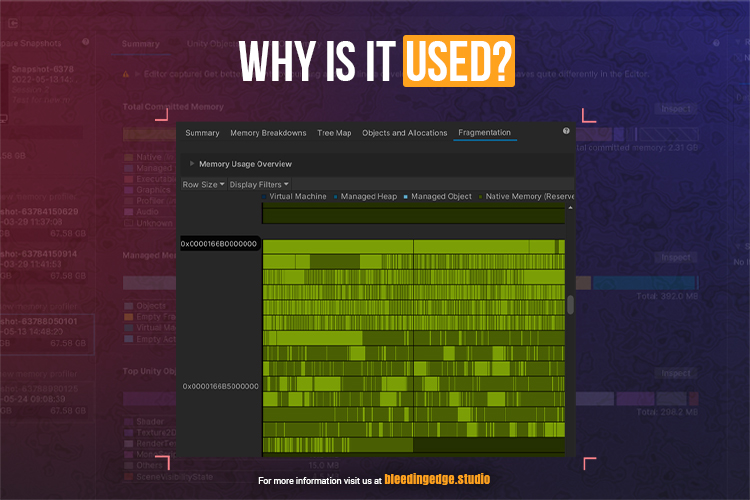
- Memory Leak Visualization:
- Some tracking Unity Memory Profiler offer visual representations of memory usage, making it easier for developers to identify trends and patterns associated with memory leaks. Graphs and charts can provide a visual overview of memory consumption over time.
- Integration with Version Control Systems:
- Unity Memory Profiler that integrate with version control systems allow developers to correlate changes in the codebase with memory-related issues. This feature facilitates collab among team members and helps identify whether specific code changes contribute to memory leaks.
- Memory Leak Prevention Strategies:
- Tracking profilers can assist in the development of proactive strategies to prevent memory leaks. By analyzing the characteristics of identified leaks, developers can implement best practices and coding patterns that minimize the likes of similar issues occurring in the future.
- Threshold-Based Alerts:
- Unity Memory Profiler may allow developers to set threshold-based alerts for memory usage. When memory usage exceeds predefined thresholds, the profiler can trigger alerts, providing early warnings about potential memory leaks or excessive memory consumption during specific game scenarios.
- Memory Leak Reports:
- Unity Memory Profiler often generate detailed reports summarizing the findings related to memory leaks. These reports can include information about the types of objects causing leaks, their locations in the code, and recommendations for optimization. Such reports serve as valuable documentation for developers and can aid in post-analysis.
- Cross-Platform Compatibility:
- Tracking profiles that support multiple platforms enables developers to analyze memory usage consistently across different devices and operating systems. Cross-platform compatibility is essential for addressing memory-related issues that may manifest differently on various platforms.
- Memory Leak Testing Scenarios:
- Create specific testing scenarios to simulate conditions that may lead to memory leaks. By deliberately inducing memory-intensive situations, developers can use tracking profilers to observe how the game behaves and identify potential memory leaks triggered by these scenarios.
- Collaboration with QA Teams:
- Involve Quality Assurance (QA) teams in the memory leak detection process. Unity Memory Profiler can be used to capture memory profiles during testing, and collaboration with QA teams ensures that potential memory leaks are identified in different testing environments and scenarios.
- Offline Analysis of Memory Snapshots:
- Some profilers allow for the offline analysis of memory snapshots, enabling developers to review and analyze memory data even after the gameplay session. This feature is beneficial for in-depth analysis and debugging.
- Post-Mortem Analysis:
- Conduct post-mortem analysis of memory leaks after identifying and resolving them. Understanding the factors that led to specific memory leaks can inform future development practices and help prevent similar issues in subsequent projects.
- Educational Opportunities:
- Use memory leaks as educational opportunities for the development team. Conduct knowledge-sharing sessions or workshops to discuss the identified memory leaks, their resolutions, and the lessons learned. This promotes a culture of long lasting improvement and shared expertise.
Conclusion
Unity Memory Profiler is a powerful tool that empowers developers to create memory-efficient games. By understanding and leveraging its features, developers can identify and address memory-related issues, ensuring a smooth and optimized gaming experience for players. Regular profiling, collaboration with other profiling tools, and adherence to best practices are crucial to maximizing the benefits of Unity Memory Profiler. As game development continues to push boundaries, effective memory management remains a critical aspect of delivering high-quality and immersive gaming experiences.
For more topics, see https://bleedingedge.studio/blog/